This article originally appeared in The Bar Examiner print edition, Spring 2021 (Vol. 90, No. 1), pp. 73–85. By Mark R. Raymond, PhD; April Southwick; and Mengyao Zhang, PhD People from both historically and socioeconomically disadvantaged groups often obtain lower scores on standardized tests. Score differences occur during elementary school on tests of academic achievement and aptitude1 and later in life on college admissions tests2, employment tests3, and licensure tests4. The legal profession is no exception, with Black and Hispanic examinees obtaining lower mean scores than White examinees on the Law School Admission Test (LSAT) and on the bar examination.5
These troubling score differences lend themselves to different interpretations. One view is that the discrepancies exist because standardized tests are biased, and that eliminating the bias in the tests will reduce or eliminate the group differences. An alternative interpretation is that score differences are a consequence of the disparities in educational and economic opportunities that minority groups have experienced for generations. The National Council on Measurement in Education (NCME) advocated this view when it noted that “[d]ifferences in socioeconomic status and quality of education exist across racial/ethnic groups in this country. Criticizing test results for reflecting these inequities is like blaming a thermometer for global warming.”6 A similar interpretation is implied in the Standards for Educational and Psychological Testing (hereafter referred to as “the Standards”), which state that group differences in test scores should lead to rigorous investigation to identify possible sources of the differences; however, such differences do not in themselves indicate the presence of measurement bias (see discussion below).7 Other writers have endorsed this perspective.8
Studies of the bar exam are consistent with the interpretation that score differences among groups are not necessarily indicative of test bias. Research on the Multistate Bar Examination (MBE)9 and the California Bar Examination10 indicate that minority group differences in bar exam scores are similar in magnitude to the minority group differences observed in law school grades and on the LSAT. The authors of the California study concluded that “[t]he bar exam itself is not the source of the differences. It merely reflects the disparities that were present when the students graduated from law school.”11
Although it is often acknowledged that members of minority groups are more likely to experience socioeconomic disadvantages early in life, research also indicates that such disadvantages can persist into graduate education. A study of the Texas Bar Examination found that students who worked during the weeks leading up to the bar exam obtained lower scores, presumably because they had less opportunity to prepare. Black and Hispanic students were about 1.5 times more likely to be among those who worked during the pre-examination period.12
In this article, we discuss test bias, describe methods for detecting bias when it does exist, and illustrate strategies employed by many testing agencies to help ensure that tests are fair. But first, we’ll discuss what is meant by test bias and identify potential sources of unfairness in tests.
Score Differences and Test Bias
Impact, Adverse Impact, and Disparate Impact
The Uniform Guidelines on Employee Selection Procedures13 (29 C.F.R. § 1607.4) were designed to promote fairness and eliminate discrimination in employment testing. The Guidelines state that adverse impact exists if the selection rate for a group with protected status is less than 80% of that for the group with the highest selection rate. This is also known as the four-fifths rule. The term disparate impact was later introduced by the Civil Rights Act of 1991.14 Since that time, the measurement community has adopted the abbreviated term impact “to describe the observed difference between the average scores for two groups on a particular test or test item.”15 Once impact has been documented, a testing agency is obligated to conduct a fairness investigation to determine whether the score discrepancies accurately reflect differences in the attributes that the test is intended to measure or are a result of test bias.16
Measurement Bias, Test Bias, and Test-Item Bias
Test bias occurs when test scores do not have the same interpretation or meaning for all subgroups of examinees.17 Bias and unfairness in test materials can often be traced to one of two underlying problems: construct underrepresentation or construct-irrelevant variance. The term construct refers to the attributes that a test is intended to measure.18 Examples of constructs in legal education include doctrinal knowledge such as knowledge of contract law and skills such as legal writing.
Construct underrepresentation refers to the degree to which a test fails to capture salient aspects of the construct being measured.19 All tests involve sampling from a larger domain of knowledge and skills, but this can become a problem if the test samples too narrowly from the knowledge and skills that were meant to be included. For example, construct underrepresentation could occur if certain subjects were not adequately represented on an exam. If a form of the MBE failed to include a sufficient proportion of test items pertaining to contract law, for example, scores on the test would be systematically lower for those students who are particularly strong in contract law and weak in other areas. Construct underrepresentation becomes a fairness issue if some groups are differentially affected by the absence of certain content from a test.
Tests are designed to measure individual differences on constructs such as knowledge of contract law and legal writing skill. Test score variance is an index for summarizing the range of examinee scores on a test. Construct-relevant variance is a result of examinee differences on the knowledge and skills that a test is designed to measure; it is a desirable feature. In contrast, construct-irrelevant variance (CIV) is caused by differences in examinee characteristics that are not relevant to the purpose of the test. Construct-irrelevant variance refers to variance in test scores “that is attributable to extraneous factors that distort the meaning of test scores and thereby decrease the validity of the proposed interpretation.”20
Construct-irrelevant variance can produce artificially high or low scores for some examinees. As an example, multiple-choice questions, if not carefully written, are susceptible to “test-wiseness.”21 If some students are able to rule out obviously implausible choices on some questions, their odds of guessing correctly are markedly increased, and their scores will be systematically inflated. In such instances, the test-item format would be considered a source of CIV.22
As another example, consider an essay question that is intended to assess knowledge of contract law. Now picture an exceptional writer who knows little of contract law but bluffs his way into an answer through the elegance of his prose. This examinee’s test scores will contain CIV to the extent that the essay grader is influenced by writing skill rather than by mastery of the subject. If the test is intended to assess understanding of contract law, writing skill would be regarded as a source of CIV. However, if the test also is intended to assess legal writing, then writing skill would be regarded as construct relevant. Whether test score variance is relevant or not depends on the purpose of the test.
Measurement bias occurs when scores on a test or a test item are systematically lower or higher for some definable group of examinees due to factors unrelated to the construct of interest.23 A lower mean score or a lower pass rate for a group of examinees is not sufficient to declare that a test is biased; the score differences must be attributable to CIV, construct underrepresentation, or some other source of unfairness (e.g., an examinee not having access to high-speed internet for an online test). Bias can manifest itself at the level of the individual test question or at the level of the total test score.
Strategies for Preventing and Detecting Bias
Although we all can agree on the importance of fairness in testing, what is fair? The Standards recognize that fairness “has no single technical meaning and is used in many different ways in public discourse.”24 Instead of a single definition, the Standards offer multiple perspectives on fairness, including the equitable treatment of test takers, absence of bias, accessibility of content, and validity of score interpretations.25 Fairness “requires treating people with impartiality regardless of personal characteristics such as gender, race, ethnicity, or disability.”26
The Standards27 identify four sources of evidence for validating the use of test scores. They include evidence based on (1) test content, (2) the cognitive response processes required, (3) the internal structure of the test, and (4) the relationship of test scores with external measures. These sources of evidence provide a framework for evaluating fairness and bias for specific groups of examinees. If a particular source of evidence does not lead to the same conclusions for all examinees, then the potential for bias exists. It is not essential that every testing program evaluate all four types of evidence—the applicable evidence depends on the purpose of the test and the types of decisions that the test scores are intended to support.28 As a practical matter, a testing program may not have the resources or have access to the data required for every type of investigation.
Table 1 lists the four types of validity evidence and presents sample strategies for collecting each type. Some strategies apply to individual test items, while others apply to the total test score. Next we’ll illustrate how some of these strategies have been applied to detect and prevent test bias within the context of the legal profession.
Table 1. Strategies for Detecting and Preventing Bias
|
Examples of Strategies to Minimize Bias |
| 1. Relevance and accessibility of test content |
|
| 2. Cognitive response processes required |
|
| 3. Internal structure of the test |
|
| 4. Relationship of test scores with external measures |
|
Relevance and Accessibility of Test Content
Practice Analysis
Authorities stress the importance of basing licensure examinations on a job analysis or practice analysis.29 A practice analysis identifies the job activities required for practice and determines the knowledge and skills required to perform those activities.30 Over the past decade, practice analyses have been completed in professions such as accounting, architecture, medicine, nursing, and pharmacology, to name a few.
NCBE periodically conducts practice analyses to ensure that its tests are job-related. A previous practice analysis was completed in 2012, and the most recent one concluded at the end of 2019. For the recent project, practice surveys were completed by more than 14,000 lawyers, including more than 1,700 minority group respondents. The analyses uncovered numerous insights into the practices of majority and minority respondents. As of this writing, panels of subject matter experts (SMEs) representing the legal education and legal practice communities are evaluating survey results and formulating recommendations for a test blueprint to guide the bar exam of the future. The SME panels are addressing questions such as the following:
- What knowledge and skills are required for entry-level practice regardless of ethnicity, practice setting, geographic region, and other demographic factors?
- How much of the bar exam should be allocated to doctrinal knowledge and how much to skills such as legal research and writing?
- What skills should be excluded from the bar exam, either because they elude valid assessment or because they are best left to other mechanisms?
Conducting an empirical practice analysis and involving a broadly representative group of SMEs in test blueprint development help to ensure that examinations cover the constructs most critical to practice for all newly licensed individuals. But this is just the first step in achieving fairness. As described next, it is then necessary to adhere to rigorous test item writing and review processes and to administer the test in a manner that guarantees that all examinees will have a fair opportunity to demonstrate their knowledge and skills.
Fairness in Item Development
Test development is a collaborative effort involving the expertise of numerous groups, including test editors, item writing (drafting) committees, independent reviewers, and psychometricians.31 Each of these groups has a role in ensuring fairness. Item development processes specific to NCBE have been described in previous issues of the Bar Examiner32 and therefore won’t be explained here other than to give a quick overview. The steps involved in item development include individual item drafting, staff editorial review and comment, item revision, full committee review, independent external review, item pretesting and statistical analysis, and review and approval of pretested items.
Testing organizations typically select committee members to be broadly representative of the profession.33 Diversity of input is key to ensuring that test content is fair, accurate, and relevant to practice. For example, the seven drafting committees that create content for the MBE are made up of a diverse mix of legal professionals in terms of race, ethnicity, gender, and geographic region, and include practicing attorneys, judges, and law school faculty members. To complement the diversity of input into item development, it is also necessary for testing organizations to develop or adopt fairness guidelines and to train item drafters and reviewers in the application of such guidelines. These guidelines help editors, item drafters, and reviewers identify and eliminate sources of CIV.34
NCBE item drafters are trained to avoid test content that could be confusing, inflammatory, offensive, or distracting to examinees or that could reinforce negative stereotypes. Consistent with Standard 3.2, test developers should “…use language in tests that is consistent with the purposes of the tests and that is familiar to as wide a range of test takers as possible.”35 This is an understated but critical point and is particularly applicable to the type of content that appears on examinations in the legal profession.
Questions on the bar examination are intended to measure legal knowledge and skill. However, scenarios in test questions about the law very often involve subject matter outside of the legal profession. A test question might include terminology from the world of finance, construction, engineering, medicine, or a number of other fields. Encountering unfamiliar terminology can be distracting to examinees. To the extent that a question depends on knowledge of a topic outside the legal field, it is construct-irrelevant and therefore is potentially unfair unless steps are taken to mitigate the CIV. As an example, a question about medical malpractice that contains the term “hypothermia” might require a definition in parentheses (e.g., “a dangerous loss of body heat”). Alternatively, the question can be edited to remove the technical medical term and replace it with a phrase that is more generally understood.
In addition to avoiding or defining technical terminology, it is important to avoid the use of regionalisms. Regionalisms are words or phrases that carry different meaning in various parts of the country or expressions that are limited to certain regions. For example, some areas refer to a sandwich as a “hero” or a scarf as a “muffler,” and not everyone understands that a “snow day” means schools are closed due to weather.
Similarly, it is important for items to avoid scenarios or events known only to a subset of society (i.e., references to a religious custom or the rules of a sporting event). This also includes the use of idioms or figures of speech such as using “hit the hay” to reference going to bed. Similarly, although it may (or may not) be acceptable to include humor or popular culture (e.g., references to movies) in classroom tests, there is no place for such references on high-stakes tests.
The preceding examples represent what Zieky, a measurement scholar from ETS, referred to as cognitive sources of CIV.36 He also identified several affective sources of CIV—words or phrases that evoke strong or distracting emotions. Unless required for valid measurement, it is best to avoid topics that are extremely disturbing or controversial, or that reinforce a demeaning stereotype.
To promote inclusion and avoid stereotypes, test questions that reference occupations or social roles should include both men and women or, to the extent possible, be drafted to be gender-neutral. When gender is used, effort should be made to balance male-gendered and female-gendered actors and to avoid stereotypes.
It is also important to use objective language to describe people with disabilities and to emphasize the person, not the disability, by saying, for example, “a person with a disability” or “a person who uses a wheelchair” instead of “a handicapped person.” Training, as well as having committee members from different geographic regions and with varying backgrounds, aids in minimizing these sources of CIV.
Sensitivity Review
It is generally recommended that test items undergo a sensitivity review that is independent of item drafting.37 Sensitivity review relies on experts to identify items that are “likely to be inappropriate, confusing, or offensive for groups in the test-taking population.”38
Sensitivity review for NCBE test items typically takes place as part of an external review during which a team not previously involved with developing those items independently reviews each item before it is pretested. During the external review, the team sees the newly drafted questions for the first time and provides impartial feedback based on a list of specific written criteria they were asked to evaluate. Item drafters and editors receive that feedback and can revise the items accordingly.
Equal Access to Test Content
Zieky also identified physical sources of CIV, which can include barriers associated with test layout and production (e.g., subtle differences in text color, small font, excessive scrolling) and the test administration environment.39 Principles of fairness dictate that all test takers must have access to test content.
Some examinees may require accommodations or alterations to the way a test is presented to allow them to have the same opportunity as other test takers to demonstrate their knowledge and skills. Many testing organizations offer tests in many versions to meet the needs of test takers with disabilities. For example, the MBE is created in audio, Braille, and a variety of large-print formats. While the standard MBE is a two-part exam, it is also created in four-, six-, and eight-part sets for examinees who require a modified testing schedule. The exam is also available on a laptop with preinstalled assistive software or in an electronic format to permit test takers to use assistive software on their own computers. Additionally, custom versions of the exam can be created for test takers with other specific needs, such as having the exam printed on a certain color of paper or in a specific font size.
Cognitive Response Processes
Analysis of Examinee Engagement
When tests make explicit claims regarding the cognitive processes required to respond to test items, it is important to make sure that the test measures such processes for all groups of examinees. Consider a test that uses short written scenarios to assess basic math skills. If such a test were to be completed by examinees who are not fluent in the language of the test, their scores might reflect language fluency rather than math skills. Verifying examinee response processes is most relevant for test items intended to assess specific psychological attributes (e.g., spatial orientation, inductive reasoning). It is less relevant for multiple-choice examinations that assess content knowledge, where the primary objective is to determine whether examinees provide a correct response to a question, not how they arrived at that response.
However, response process is relevant to consider for performance tests that make explicit claims about the skills being assessed. The Multistate Performance Test (MPT) is designed to assess certain lawyering skills (e.g., differentiation of relevant from irrelevant facts, analysis of case law); it is not a test of legal knowledge. To ensure that successful performance is not confounded by an examinee’s knowledge of substantive law, examinees are provided with a case file and library that include all substantive information necessary to complete the assessment task. Fairness is achieved by ensuring that all examinees have equal access to the baseline information (i.e., substantive law) required to demonstrate the skills being assessed. Licensing examinations in other professions (e.g., accounting, architecture) follow a similar approach to skills testing.
One common method for investigating cognitive processes is to conduct think-aloud studies or cognitive interviews with examinees as they take a test.40 Another method is to arrange experiments that use computers to measure examinee response times or eye movements during testing.41 Studies of examinee response processes are not feasible under standardized testing conditions because they intrude on the normal test administration process. Although many useful investigations have been conducted in cognitive laboratories at universities, they generally lack the sample sizes necessary for empirical studies of test bias. However, the recent use of computers to administer high-stakes examinations affords the opportunity to obtain response-time data and related information (e.g., answer changing) under standardized conditions;42 such data can serve as a useful check on the comparability of responses for examinees from various demographic groups.
Analysis of Grader Engagement
The concept of response processes can be extended to the subject matter experts who evaluate responses to essay questions and performance tests. Testing organizations employ a variety of quality-control procedures to ensure that graders apply scoring rubrics and grading criteria in the manner intended and that ratings are not influenced by characteristics such as handwriting, spelling, or other extraneous factors.43 For the bar examination, these quality-control procedures include the development of detailed scoring guidelines, systematic grader training and calibration, and meticulous administrative controls.44
Although NCBE develops grading materials for the Multistate Essay Examination (MEE) and the MPT, the responsibility for scoring falls to individual jurisdictions. A 2004 Bar Examiner article describes the training procedures and administrative controls one jurisdiction employs to ensure fairness.45 For example, to eliminate the potential for bias associated with examinee characteristics (e.g., race, gender, state of residence), graders are blinded to the identity of the examinee. Other controls include, but are not limited to, randomly assigning responses to graders, spreading responses from one examinee across multiple graders, assigning responses to graders to achieve balance in workload and complexity (e.g., each grader receives a roughly equal number of responses from repeat examinees), and assigning two graders to each response (or to examinees with borderline responses). Furthermore, to detect and correct for the possibility that graders “drift” over time, calibration essays are mixed back into unscored essays for rescoring.
Internal Structure of the Test
Fairness is also addressed using empirical methods. After every test administration, comprehensive statistical analyses are conducted at the item level and total test score level. The overarching purpose of these analyses is to provide test results that are reliable, accurate, and unbiased.
Item Analyses
All test items are subjected to a statistical quality-control process known as item analysis when they are first pretested as unscored items, and then routinely after that when used as scored items.46 Item analysis is one way to ensure that each question functions in a manner that is consistent with expectations. Each item is evaluated in terms of the percentage of examinees answering the question correctly, how well it differentiates between examinees with low and high scores on the entire exam, and the statistical properties of each incorrect answer choice.
As an example, the item analysis for the MBE produces more than 25 indices for each multiple-choice question. Interpreting the data from an item analysis truly requires a meeting of the minds—item drafters, test editors, and psychometricians typically meet in person or by telephone to discuss items with suspicious statistics. Item analyses are helpful for identifying unexpectedly difficult items, items with ambiguous wording, items with terminology that is not universally understood by the examinee population, or items that otherwise lend themselves to potential misinterpretation.
Differential Item Functioning
Additional empirical methods, known as differential item functioning (DIF), have been developed specifically to detect measurement bias at the level of the test item. Although there are a variety of methods for evaluating DIF,47 most define DIF as occurring when test takers of equal proficiency differ in their probabilities of answering a test item correctly as a function of their membership in a particular group based on gender, race, age, or some other characteristic.48 Another way of saying this is that a test item has DIF when examinees from two or more groups have the same degree of proficiency but different rates of success on the item.49 Many organizations, including NCBE, have adopted a DIF procedure known as the Mantel-Haenszel method.50 Although the computations behind DIF are complex, it is straightforward to illustrate at a conceptual level.
Consider two groups of examinees, Group A and Group B. Divide each group into five different levels based on their overall proficiency (i.e., their total test scores). For example, those at the highest overall proficiency level might have scored between 85% and 100% correct on the test, while those at the next level of proficiency scored between 70% and 84% correct, and so on. Now, for a single test item, let’s calculate the percentage of examinees at each proficiency level within each group who answer the item correctly.
Assume that we obtain the outcome shown in Figure 1. In this stylized example, Group A examinees have lower rates of success on the item than Group B examinees at any proficiency level. At the “very low” level only 20% of those in Group A answered the item correctly, while 45% of those in Group B did. There is a similar difference at the “low” level. Although there still are differences at the three highest proficiency levels, the differences are smaller. This item exhibits DIF because examinees at the same level of proficiency do not have the same rates of success on the item. In real life, the data would be subjected to a formal test to determine if the group differences are statistically significant. One of the problems with DIF is that each test item is subjected to statistical testing, and with so many statistical tests there is a chance of a false-positive error, which means that an item could be flagged as having DIF even though it really does not.
Figure 1. Hypothetical example illustrating differential item functioning (DIF) for a test item

As the Standards note, “the detection of DIF does not always indicate bias in an item.”51 A finding of DIF calls for further investigation into the features of the item that may explain the underlying cause of group differences. As with the interpretation of item analyses, interpreting DIF requires a meeting of the minds of item drafters, test editors, and psychometricians to carefully review the item text and examinee response data.
One question that arises with DIF is what groups should be considered for analysis. Examples include, but are not limited to, groups defined by race, ethnicity, gender, socioeconomic status, age, language, culture, or disability.52 The challenge is having sample sizes that are large enough to provide dependable results. To obtain adequate sample sizes, it may be necessary to combine people from different sociolinguistic regions into a single group—for example, those from Japan, China, and the Philippine Islands might be grouped together. It is possible that this type of aggregating could mask subgroup differences. Another potential limitation of DIF is the use of total test scores for placing examinees into proficiency levels. In many situations it is desirable to look beyond the test being investigated for validity evidence.
Relationship of Test Scores with External Measures
The previous fairness strategies involve inquiries internal to a particular test. They address questions such as the following: Does the test content represent the knowledge and skills required for entry-level lawyers? Are items written in a manner that minimizes sources of CIV? Is an item easier or more difficult for a particular group of examinees? Fairness also can be investigated by evaluating evidence external to the test under consideration. Such investigations are usually conducted at the test score level.
The external evidence might be based on measures of related skills—for example, test scores on a professional licensure test might be expected to be more strongly related to course grades in professional training courses than with SAT scores or socioeconomic status. The main idea is that the pattern of relationships for the majority group should be similar to the pattern for the minority groups. Alternatively, the external measure could be an outcome that a test is supposed to predict. For example, college admissions tests are intended to predict success in college, and their predictive accuracy should be similar for subgroups of examinees.
Relationships with Tests Measuring Similar Skills
This strategy is illustrated by a recent study of the bar examination directed by the New York State Court of Appeals.53 The purpose of the study was to evaluate the impact of the adoption of the Uniform Bar Examination (UBE) on candidate bar exam performance. The study involved candidates taking the bar exam in New York just prior to or following New York’s adoption of the UBE. The analyses focused on UBE scores; the external measures included undergraduate grade point average (UGPA), LSAT score, and law school grade point average (LGPA). Information related to race/ethnicity and gender also was available.
The full report includes numerous analyses that address many issues; for the purpose of this article, we concentrate on a few results relevant to matters of test bias. First, UBE test scores and pass rates increased slightly over the study period, and this increase was observed for all race/ethnicity groups. Second, all groups also had patterns of increasing scores on the other academic indicators (UGPA, LSAT, and LGPA) over the three-year period. Third, members of racial/ethnic minority groups had lower mean scores and lower pass rates on the UBE than majority group members, and lower outcomes on the other academic indicators. Fourth, there were moderate to strong relationships between bar exam performance and the other academic indicators, especially between UBE scores and LGPA; furthermore, these relationships were consistent across race/ethnicity and gender groups. From a psychometric perspective, it is encouraging that the UBE scores have the same pattern of relationship with other measures for all subgroups. However, from a social perspective, it is discouraging to see lower scores for minority groups on any of the measures.
Predicting Future Performance
When test scores are used to predict an outcome on some criterion (e.g., success in college, job performance), it is important to verify that the scores possess a reasonable degree of predictive accuracy, and that the level of accuracy is the same for all groups. Thus, test scores are considered unbiased if predicted scores on the outcome are not systematically too high or too low for any group. This type of test bias is often referred to as differential prediction and is investigated using a statistical method called regression analysis. When investigating differential prediction, the question to answer is, “Does each group require its own regression equation to maximize predictive accuracy, or does a single equation (i.e., regression line) predict equally well for both groups?”
Figure 2 illustrates a situation where the members of Group A (+) and Group B (◦) each had taken a college admissions test, and a year later their grade point averages (GPAs) were obtained. Each symbol in the graph represents the test score and the GPA for a student. For instance, the arrow in the upper-right section of the graph points to a student who had an admissions test score of 86 and a GPA of 3.7. It can be seen that higher test scores are generally associated with higher GPAs. The mean scores for each group are imprinted on the x and y axes.
Figure 2. Hypothetical example illustrating unbiased college admissions test scores even though Group A scores lower than Group B
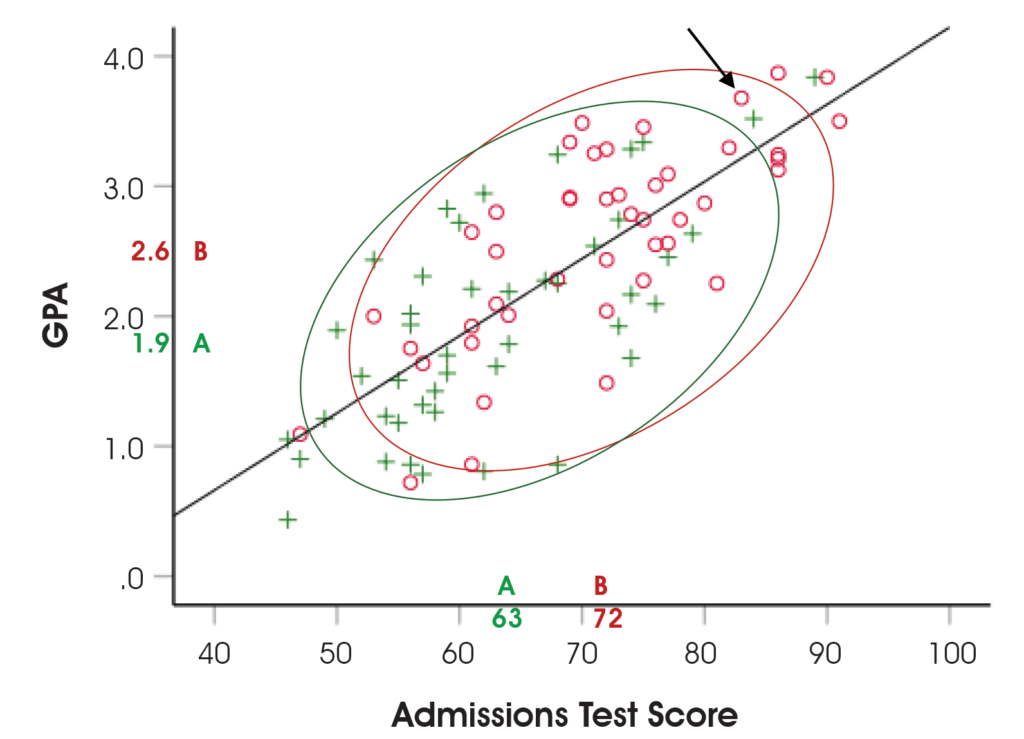
The two ellipses in Figure 2 encompass about 90% of the scores in each group. We computed separate regression lines for each group and found the two regression lines to be nearly indistinguishable, indicating that the single line, shown in Figure 2, would be equally effective for both groups. Because a single regression line predicts GPA equally well for both groups, the use of test scores for this purpose is not biased according to the definition.
This hypothetical example illustrates that even though test scores can be lower for a group, if that group’s scores on the outcome measure also are lower, then bias may not exist. Bias would exist if, for example, the two groups had the same mean GPA but Group A scored lower on the admissions test. In that situation, the green ellipse for Group A would be higher on the graph, and Group A’s GPAs would be underestimated by a single regression line.
The LSAT provides a real-world example of predictive evidence. The LSAT is designed to predict success in law school, so this type of validity evidence is central to ensuring fair use of LSAT scores, and the Law School Admission Council (LSAC) periodically publishes the results of predictive validity studies. The most recent studies54 indicated that LSAT scores, when used alone, slightly underpredicted first-year LGPA for women and slightly overpredicted first-year LGPA for minority groups (Asian, Black, and Hispanic), and that these small errors of prediction could be reduced by combining LSAT scores with undergraduate GPAs to make admissions decisions.
Studies of differential prediction are not without limitation. One criticism is that if the same type of unfairness that permeates a predictor test also is present in the outcome measure, then any bias may remain hidden. Also, predictive validity has little applicability to licensure tests.55 Licensure tests are not intended to predict future performance; rather, their purpose is to verify that newly licensed practitioners have acquired the knowledge and skills required for competent practice at entry into the profession. As a practical matter, it is usually very difficult to obtain valid measures of job performance for large samples of practitioners. Even when outcomes are available for licensed individuals, outcome data will not be available for those individuals who failed the licensure exam, because those individuals would not have been permitted to practice. This creates what is known as the “restriction of range” problem, which degrades the accuracy of regression analyses.
Despite these limitations, there are instances of predictive validity studies demonstrating that physicians with lower test scores on a licensure examination are at greater risk for patient complaints and disciplinary action,56 and studies in the legal profession showing higher rates of disciplinary action in jurisdictions that formerly granted diploma privilege in lieu of a licensure test.57 Licensure exams also can serve as an outcome or criterion variable for predictive studies. Studies have shown, for example, that law school grades are more effective than LSAT scores for predicting bar exam performance,58 and that students who are accommodated with extra time on a college admissions test have lower rates of success on the medical licensure test.59 These types of studies provide useful information even though they have certain limitations.
Summary and Conclusions
This article describes some of the steps that can be taken to ensure that tests are fair, reliable, and accurate for all examinees. Now, more than ever before, is a time for testing organizations to evaluate the assessments they develop and administer. This includes the use of systematic procedures to ensure that test content fully represents the knowledge and skills that it is intended to measure; that it is free of confusing, inflammatory, offensive, or distracting language; and that it provides equivalent opportunities for all examinees to demonstrate their knowledge and skills.
Bias prevention depends primarily on the judgments of the subject matter experts who develop and review the tests. If a biased item somehow eludes early detection, statistical methods can be used to flag potential bias. Although the empiricists amongst us may prefer the statistical methods, those methods—as solid as they are—have their limitations. At the end of the day, we depend on the sensitivity and judgment of subject matter experts to ensure that tests are fair. Our experience has been that this faith is well placed.
Despite society’s efforts to equalize academic opportunity, gaps in standardized test scores persist. To the extent that test scores gauge the effectiveness of efforts to narrow the gap, the scores suggest that such efforts have not been very effective. However, eliminating standardized tests as a way to eliminate the score differences runs the risk of lulling us into complacency and a false sense of social accomplishment when in fact much remains for us to achieve.
Notes
- R.L. Hale, M.R. Raymond, and A.H. Gajar, “Evaluating Socioeconomic Status Bias in the WISC-R,” 20(2) Journal of School Psychology 145–149 (1982). (Go back)
- US Department of Education, National Center for Education Statistics, Digest of Education Statistics, 2018 (NCES, 2019), Table 226.10; R. Zwick, “Higher Education Admissions Testing,” in R.L. Brennan (ed.), Educational Measurement, 4th ed. (American Council on Education and Praeger, 2006), pp. 646–679. (Go back)
- R.E. Ployhart, J.C. Ziegert, and L.A. McFarland (2003), “Understanding Racial Differences on Cognitive Ability Tests in Selection Contexts: An Integration of Stereotype Threat and Applicant Reactions Research,” 16(3) Human Performance 231–259, available at https://doi.org/10.1207/S15327043HUP1603_4. (Go back)
- S.E. Phillips and W.J. Camara, “Legal and Ethical Issues,” in R.L. Brennan (ed.), Educational Measurement, 4th ed. (American Council on Education and Praeger, 2006), pp. 733–755; J.D. Rubright, M. Jodoin, and M.A. Barone, “Examining Demographics, Prior Academic Performance, and United States Medical Licensing Examination Scores,” 94(3) Academic Medicine 364–370 (2019). (Go back)
- L.F. Wightman and H. Ramsey, Jr., “LSAC National Longitudinal Bar Passage Study.” Law School Admission Council, LSAC Research Report Series (1998). (Go back)
- National Council on Measurement in Education, position statement (2019), “Group Differences in Average Test Scores,” available at https://www.ncme.org/blogs/megan-welsh1/2019/12/20/ncme-position-statement-misconceptions-about-group. (Go back)
- American Educational Research Association (AERA), American Psychological Association, and National Council on Measurement in Education, Standards for Educational and Psychological Testing (AERA, 2014),p. 54. (Go back)
- G. Camilli, “Test Fairness,” in R.L. Brennan (ed.), Educational Measurement, 4th ed. (American Council on Education and Praeger, 2006), pp. 221–256; M.J. Zieky, “Developing Fair Tests,” in S. Lane, M.R. Raymond, and T.M. Haladyna (eds.), Handbook of Test Development, 2nd ed. (Routledge, 2016), pp. 81–99. (Go back)
- A.A. Mroch and M.A. Albanese, “The Testing Column: Did UBE Adoption in New York Have an Impact on Bar Exam Performance?” 88(4) The Bar Examiner 34–42 (2019–2020); D.R. Ripkey and S.M. Case, “A National Look at MBE Performance Differences Among Ethnic Groups,” 76(3) The Bar Examiner 21–28 (2007). (Go back)
- S.P. Klein and R. Bolus, “The Size and Source of Differences in Bar Exam Pass Rates Among Racial and Ethnic Groups,” 66(2) The Bar Examiner 8–16 (1997). (Go back)
- Id. (Go back)
- S.P. Klein and R. Bolus, “Analysis of July 2004 Texas Bar Exam Results by Gender and Racial/Ethnic Group” (2004), available at https://ble.texas.gov/statistics. (Go back)
- Equal Employment Opportunity Commission (EEOC), Uniform Guidelines on Employee Selection Procedures, 29 C.F.R. § 1607.4 (1978). (Go back)
- Pub. L. No. 102-166, 105 Stat. 1071 (1991) (codified as amended in scattered sections of 42 U.S. Code). (Go back)
- P. Holland and D. Thayer, “Differential Item Performance and the Mantel- Haenszel Procedure,” in H. Wainer and H. Braun (eds.), Test Validity (Lawrence Erlbaum, 1988), pp. 129–146. (Go back)
- Camilli, supra note 8. (Go back)
- AERA et al, supra note 7, at 51–54. (Go back)
- Id. at 217. (Go back)
- Id. at 12; S. Messick, “Validity,” in R.L. Linn (ed.), Educational Measurement (American Council on Education, 1989), pp. 13–104. (Go back)
- AERA et al., supra note 7, at 217; Messick, supra note 19. (Go back)
- T.M. Haladyna and M.C. Rodriguez, Developing and Validating Test Items (Routledge, 2013). (Go back)
- Messick, supra note 19. (Go back)
- AERA et al., supra note 7; Camilli, supra note 8. (Go back)
- AERA et al., supra note 7, at 49. (Go back)
- Id. at 50–51. (Go back)
- Educational Testing Service, ETS Standards for Quality and Fairness (ETS, 2002), p. 17. (Go back)
- AERA et al., supra note 7. (Go back)
- Id. at 14. (Go back)
- Id., EEOC, supra note 13. (Go back)
- M.T. Kane, “The Validity of Licensure Examinations,” 37 American Psychologist 911–918 (1982); M.R. Raymond, “Job Analysis and the Specification of Content for Licensure and Certification Examinations,” 14 Applied Measurement in Education 369–415 (2001). (Go back)
- Haladyna & Rodriguez, supra note 21. (Go back)
- C.B. Hill, “MBE Test Development: How Questions are Written, Reviewed, and Selected for Test Administrations,” 84(3) The Bar Examiner 23–28 (2015); J. Kane and A. Southwick, “The Testing Column: Writing, Selecting, and Placing MBE Items: A Coordinated and Collaborative Effort,” 88(1) The Bar Examiner 23–28 (2019); T. Davis and M.G. Glenn, “How Are Questions Written for NCBE Exams? Part One: Two Multiple-Choice Question Drafters Share the Process,” 88(3) The Bar Examiner 25–32 (2019). (Go back)
- Haladyna & Rodriguez, supra note 21. (Go back)
- Zieky, supra note 8. (Go back)
- AERA et al., supra note 7, at 64. (Go back)
- Zieky, supra note 8. (Go back)
- Camilli, supra note 8; Zieky, supra note 8. (Go back)
- AERA et al., supra note 7, at 88. (Go back)
- Zieky, supra note 8. (Go back)
- B.S. Heist, J.D. Gonzalo, S. Durning, D. Torre, and D.M. Elnicki, “Exploring Clinical Reasoning Strategies and Test-Taking Behaviors During Clinical Vignette Style Multiple-Choice Examinations: A Mixed Methods Study,” 6(4) Journal of Graduate Medical Education 709–714 (2014). (Go back)
- M.A. Lindner, A. Eitel, G. Thoma, I.M. Dalehefte, J.M. Ihme, and O. Köller, “Tracking the Decision-Making Process in Multiple-Choice Assessment: Evidence from Eye Movements,” 28(5) Applied Cognitive Psychology 738–752 (2014). (Go back)
- The Multistate Professional Responsibility Examination (MPRE) moved to computer-based test delivery in 2020, and the Law School Admission Council has recently used computer-based delivery for the LSAT. (Go back)
- AERA et al., supra note 7. (Go back)
- See D.F. Bosse, “The MPT: Assessment Opportunities Beyond the Traditional Essay,” 80(4) The Bar Examiner 17–21 (2011); K. Early, “Practices and Procedures to Improve Grading Reliability on Essay Examinations: A Guide to the Care and Feeding of Graders,” 73(4) The Bar Examiner 6–10 (2004); J.A. Gundersen, “MEE and MPT Test Development: A Walk-Through from First Draft to Administration,” 84(2) The Bar Examiner 29–34 (2015); S. Olson, “13 Best Practices for Grading Essays and Performance Tests,” 88(4) The Bar Examiner 8–14 (2019–2020). (Go back)
- Early, supra note 44. (Go back)
- Haladyna & Rodriguez, supra note 21; J. Kane and A.A. Mroch, “The Testing Column: Testing Basics: What You Cannot Afford Not to Know,” 86(3) The Bar Examiner 32–37 (2017). (Go back)
- Camilli, supra note 8. (Go back)
- AERA et al., supra note 7, at 51. (Go back)
- Camilli, supra note 8. (Go back)
- Holland & Thayer, supra note 15. (Go back)
- AERA et al., supra note 7, at 51. (Go back)
- AERA et al., supra note 7; Camilli, supra note 8. (Go back)
- For a thorough description of this study, see Mroch & Albanese, supra note 9. The full report is available on the New York State Board of Law Examiners’ website at https://www.nybarexam.org/UBEReport.html. (Go back)
- N. Rahman and T.J. Trierweiler, Analysis of Differential Prediction of Law School Performance by Race/Ethnicity Based on 2011–2014 Entering Law School Classes, LSAT Technical Report 17-01 (Law School Admissions Council, 2017). (Go back)
- Kane, supra note 30; B.E. Clauser, M.J. Margolis, and S. Case, “Testing for Licensure and Certification in the Professions,” in R. Brennan (ed.), Educational Measurement, 4th ed. (American Council on Education and Praeger, 2006), pp. 701–731. (Go back)
- M.M. Cuddy, A. Young, A. Gelman, D.B. Swanson, D.A. Johnson, G. Dillon, and B.E. Clauser, “Exploring the Relationships Between USMLE Performance and Disciplinary Action in Practice: A Validity Study of Score Inferences from a Licensure Examination,” 92(12) Academic Medicine 1780–1785 (2017); R. Tamblyn, M. Abrahamowicz, D. Dauphinee, et al., “Physician Scores on a National Clinical Skills Examination as Predictors of Complaints to Medical Regulatory Authorities,” 298(9) Journal of the American Medical Association 993–1001 (2007). (Go back)
- R. Anderson IV and D.T. Muller, “The High Cost of Lowering the Bar,” 32 Georgetown Journal of Legal Ethics 301–325 (2019); K. Rozema, “Does the Bar Exam Protect the Public?” (2020), available at https://ssrn.com/abstract=3612481. (Go back)
- Klein & Bolus, supra note 10; N.L. Georgakopoulos, “Bar Passage: GPA and LSAT, Not Bar Reviews,” Robert H. McKinney School of Law Legal Studies Research Paper No. 2013-30 (Indiana University Robert H. McKinney School of Law, 2013); NY study supra note 53; Wightman & Ramsey, supra note 5; see also A.N. Farley, C.M. Swoboda, J. Chanvisanuruk, K.M. McKinley, A. Boards, and C. Gilday, “A Deeper Look at Bar Success: The Relationship Between Law Student Success, Academic Performance, and Student Characteristics,” 16(3) Journal of Empirical Legal Studies 605–629 (2019). (Go back)
- C.A. Searcy, K.W. Dowd, M.G. Hughes, S. Baldwin, and T. Pigg, “Association of MCAT Scores Obtained with Standard vs. Extra Administration Time with Medical School Admission, Medical Student Performance, and Time to Graduation,” 313 Journal of the American Medical Association 2253–2262 (2015). (Go back)

Mark R. Raymond, PhD, is the Director of Assessment Design and Delivery for the National Conference of Bar Examiners.

April Southwick is the Multistate Bar Examination Program Director for the National Conference of Bar Examiners.
 .
.
Mengyao Zhang, PhD, is a Senior Research Psychometrician for the National Conference of Bar Examiners.
Contact us to request a pdf file of the original article as it appeared in the print edition.
[apss_share]