This article originally appeared in The Bar Examiner print edition, Summer 2019 (Vol. 88, No. 2), pp 24–26.
By Mark A. Albanese, Ph.D.

In February 2019, the mean score on the Multistate Bar Examination (MBE) was 134.0, a 1.2-point increase from the mean score in February 2018. This was the first increase in the February mean score since 2013 and the largest increase since 2011.
The performance on MBE questions that had been repeated from previous February exams was still down from previous performance, but not as far down as in 2018, contributing to the increase in the 2019 mean score from that in 2018. This was particularly true for the subset of questions that we use for equating.
The reliability of the February 2019 MBE was 0.92, the same value as that observed in February 2018 and, when taken to the third decimal point, a new high for a February administration. Thus, the mean score increased at a point where the precision of the MBE for a February administration was at an all-time high.
Omens
I had anticipated the February 2019 results with some trepidation for several reasons. The mean MBE score in July 2018 (139.5) was the lowest July mean score since 1984 and the second lowest in MBE history. Since February examinees historically consist of over 60% repeat takers, a large percentage of whom would have taken the MBE last July, this did not seem to bode well.
Further, the mean score of 132.8 in February 2018 was not just lower than the mean score from February 2017—it was the lowest MBE mean score on record. The mean score of 134.1 in February 2017 was the previous lowest mean score on record. In fact, the mean MBE score in February had been declining every year since 2013.
I didn’t even make use of a prediction equation I had developed using data going back to 2003, being fearful of what it might show. However, now that the results are in and they show an improvement over last year, I thought I would see what the prediction equation prognosticated. To my shock, it was almost dead-on at 133.96, slightly below the 134.0 actual value but still well above the mean of 132.8 in February 2018. I could have saved myself a lot of angst if I had just decided to put my trust in the statistics. For a statistician, this is sort of embarrassing.
Equating is the statistical procedure used to compensate for any change in difficulty in any given examination to ensure that the exam’s scores have the same meaning and are directly comparable to those of previous exams. To achieve this, each exam contains a subset of questions that have appeared in previous exams to compare performance of the current examinees with that of past examinees on those questions.
Reliability is an indicator of the consistency of a set of examination scores, with a maximum value of 1.0. It is a measure of the extent to which a group of examinees would be rank-ordered the same way over multiple testing sessions.
February 2019 Exam Characteristics
So, let’s look at some of the other things that happened with the February 2019 exam.
Number of Examinees
There were more examinees—21,316 in February 2019 compared to 21,111 in February 2018. The difference of 205 examinees represents an increase of about 1%.
Mean Scores Across Jurisdictions
The increase in MBE mean scores from the previous February administration was relatively widespread across jurisdictions. Of the 52 jurisdictions that administer the MBE in February, 33 had an increase in mean scores from the previous February, and 19 had a decrease. (Delaware and Palau do not test in February; Louisiana and Puerto Rico do not administer the MBE.)
First-Time Takers and Repeaters
The percentage of examinees who were likely first-time takers continued to drop for February test takers, from 23.2% in 2018 to 21.7% in 2019. In terms of MBE average performance, the likely first-time takers and likely strong repeaters (those who have likely previously passed a bar exam) increased their MBE average slightly (about half of one point) over February 2018, whereas weak repeaters (those who have likely previously not passed a bar exam) had an increase of about 1.8 points over February 2018.
The 1.3-point differential between the weak and strong repeaters is the largest such difference since we started tracking strong and weak repeaters with the 2012 examinees. In fact, the next largest differential was only 0.6 points, and that was in the first year we could compute year-to-year changes, in 2013. After 2013 until this administration, there was only one other time when the weak repeaters had a larger gain than the strong repeaters, and it was only 0.3 points, in 2017. So, the gain made by weak repeaters in the February 2019 examination would seem to be a change in the pattern we have seen in the past seven or so years.
MPRE Results
There may be some value in looking at how performance on the Multistate Professional Responsibility Examination (MPRE) tracks with the February MBE scores. Two of the three MPRE administrations in 2018 (March and November) had higher means than in 2017. The March 2019 MPRE mean was 93.78, a 0.89-point decline from 2018, but still over 1 point higher than in March 2017 (92.66).
It is hard to know what to do with changes in the March MPRE mean score, however. In 2018, the March MPRE mean was over 2 points higher than in 2017, yet the July 2018 MBE mean score was the lowest since 1984. Perhaps the March MPRE mean is an inverse (or perverse) indicator, and the fact that the 2019 March MPRE mean is down might presage a rise in the July MBE mean score. We can only hope.
LSAT Results
But there are other reasons for hope. Looking at the law school entry indicators of the 2019 law school graduates, who will comprise the majority of July 2019 bar exam takers, the 2016 law school applicants took the largest number of LSATs since 2012 (see Figure 1). That suggests that they are the most motivated group to get into law school in four years. That has to be good, right?
Figure 1: Law School Admission Tests Administered over 10 Years
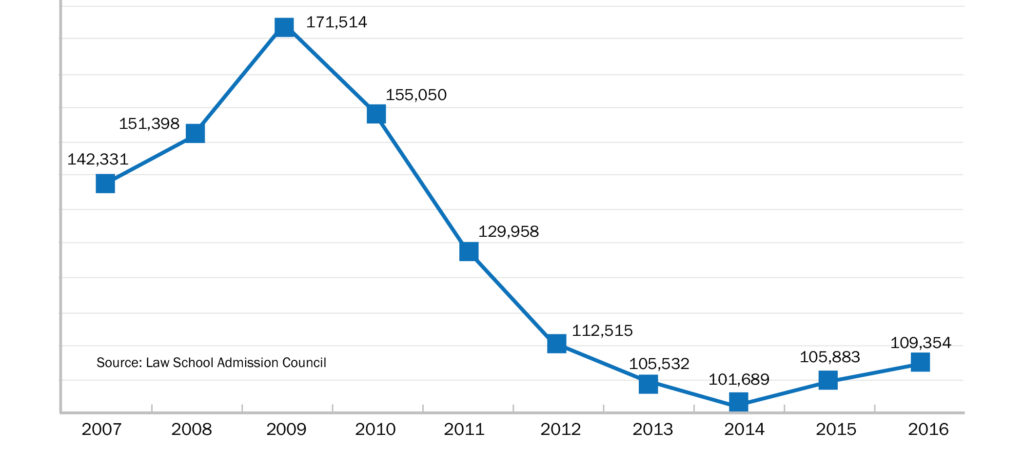
Source: http://images.law.com/contrib/content/uploads/sites/292/2017/11/Line-Graph-LSAT.jpg (from Law School Admission Council), accessed June 11, 2019.
Figure 2 shows the number of law school matriculants and the LSAT mean scores at the 25th percentile for matriculants between 2011 and 2017. The 2016 entering class had about the same number of matriculants as in 2015, but their first quartile LSAT mean score was the highest since 2013. Again, there appears to be hope for July 2019.
Figure 2: Law School Matriculants and Mean LSAT Scores at the 25th Percentile, 2011–2017

Source: ABA Section of Legal Education and Admissions to the Bar, ABA Required Disclosures, http://www.abarequireddisclosures.org/Disclosure509.aspx.
Predictions?
So, what does my prediction equation say about what will happen in July? Its prognostication is that scores will go no further down than last July and may be up some, but the margin for error makes the results potentially go either way. July will tell whether my statistics rock or random rules.
 Mark A. Albanese, Ph.D., is the Director of Testing and Research for the National Conference of Bar Examiners.
Contact us to request a pdf file of the original article as it appeared in the print edition.